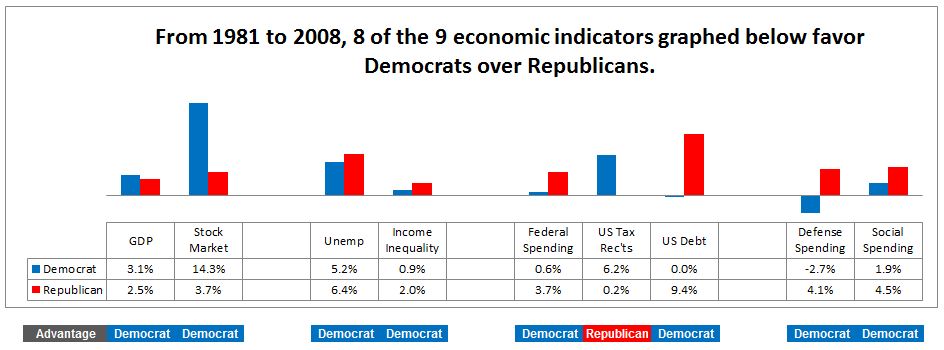
What’s graphed above is the annual change in the indicator. For instance, US Stocks earned 14.3% per year (capital appreciation plus dividends) after inflation from 1981-2008 when a Democrat was in the White House, but only 3.7% per year in the 20 years when a Republican was in the White House.
So which party was better for the US public?
- The economy, as measured by the Gross Domestic Product, grew 25% faster under Democrats.
- The stock market, which is owned 75% by the US public, grew 287% more under Democrats.
- Unemployment was 18% higher under Republicans.
- Income inequality, as measured by the increase in the mean over median family household income, grew 53% faster in the 20 years a Republican was in office. The most likely reason – tax cuts for the rich under Republicans.
- That resulted in drastically lower tax collections and it’s considered an advantage – it’s the only red cell in the Advantage row below the graph above – but when coupled with the Republicans’ higher spending, it sent the federal debt through the roof!
- It wasn’t just higher defense spending, either. Social spending on Social Security, Medicare, Medicaid, and unemployment grew 57% faster with Republicans in the White House between 1981 and 2008.
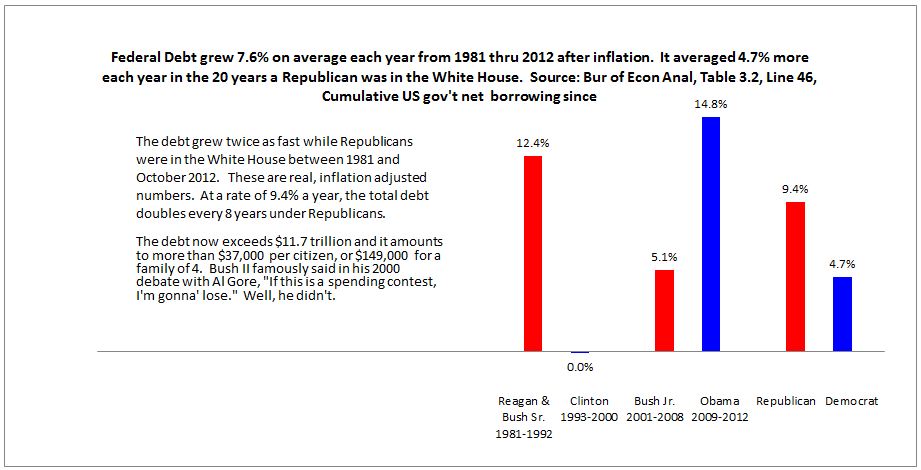
- In case you’re wondering about the debt run-up under President Obama, see the graph below. Even with the biggest, most massive debt increase since World War II, the federal debt still grew faster under Republicans.

Decide for yourself which party is better for the US economy at:
