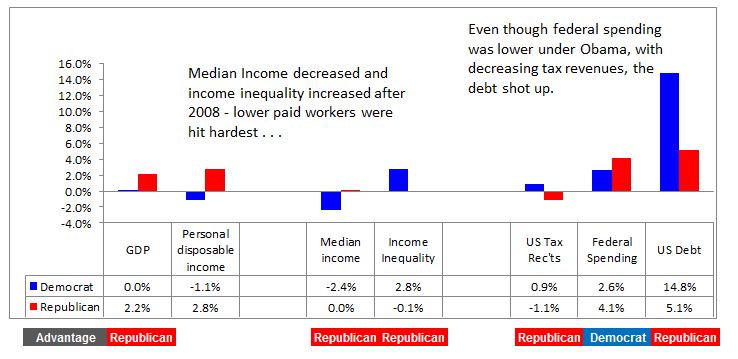
Do tax cuts increase income or income inequality?

Economic indicators from 1981-2008 provide clues about increasing income inequality in America. The annual change in the economic indicator is graphed above. For instance, GDP grew 3.1% each year when a Democrat was President and 2.5% when a Republican was President between 1981 and 2008.
Republicans maintain that decreasing taxes will increase economic activity and benefit everyone.
- Republican economic consultant Arthur Laffer said cutting taxes → increased economy → more tax revenue.
But this did not happen from 1981-2008 when Republicans held the White House for 20 years.
- Tax revenues were flat under 20 years of Republican Presidents, but increased 6.2% a year under Clinton.
Yet, the GDP increased more during the Clinton era of increasing taxes.
- This is just the opposite of what Arthur Laffer predicted.
- Personal disposable income grew at the same 3% rate regardless of which party was in the White House.
Income inequality grew faster when Republicans occupied the White House.
- Median income grew faster when President Clinton was in the White House from 1993-2000.
Income inequality happens when mean household income increases faster than median income.
- The median is the midpoint value – half of all incomes are below the median, and half are above it.
- The mean income, which is pulled up by a few high incomes, rose faster than the median when Republicans occupied the White House.
A single large income can cause the mean (or average) income to rise dramatically.

The $60,974 median and $81,007 mean income figures at the bottom right are the 2011 median and mean incomes for all US family households reported in Table F05 compiled by the US Census Bureau.
The likely conclusion is . . .
Tax cuts benefit high income earners, not the economy as a whole.
Tax cuts also cause the federal debt to rise.
- When tax revenues stay flat and spending goes up, the result is greater debt.
The Great Recession has exacerbated income inequality further.

Compare this graph, which compares the Bush administration from 2001-2008 with the Obama administration from 2009-2012, with the first graph above to see how dramatically the Great Recession has affected the US economy.
What can we conclude about tax cuts?
- Tax cuts did not spur the economy to greater heights, nor did they generate greater tax revenues from 1981-2008.
- Tax cuts benefited higher income earners and caused the federal debt to increase.
The Congressional Research Service reached the same conclusion.
- The average federal income tax rate dropped 56% for the top .1% of income earners from 55% in 1945 to 24.2% by 1990.
- The income share of top income earners rose 193%. In 1945, the top .1% earned 4.2% of annual income. By 2007 the top .1% – that’s only 315,000 Americans – earned 12.3% of the national income, an increase of 193%.
- The Summary concludes, “There is not conclusive evidence, however, to substantiate a clear relationship between the 65-year reduction in the top tax rates and economic growth. Analysis of such data suggests the reduction in the top tax rates have had little association with saving, investment or economic growth. However, the top rate reductions appear to be associated with the increasing concentration of income at the top of the income distribution.”
- Taxes and the Economy: An Economic Analysis of Top Tax Rates Since 1945, Congressional Research Services Publication R42729, Thomas L. Hungerford, Specialist in Public Finance, September 14, 2012. CRS Reports for Congress are prepared for Members and Committees of Congress.
Do your own analysis at www.presidentialeconomics.com.
Sources for the graphs in this page are listed below. They are described in more detail in the Methodology page at www.presidentialeconomics.com.
Gross Domestic Product: Bureau of Economic Analysis
Personal disposable income: Bureau of Economic Analysis
Federal Debt: Bureau of Economic Analysis, Sec 3, Gov’t Cur Rec’ts & Exp, Table 3.2, Line 46.
Federal Tax Receipts: Bureau of Economic Analysis, Sec 3, Gov’t Cur Rec’ts & Exp, Table 3.2, Line 2
Federal Spending: Bureau of Economic Analysis, Sec 3, Gov’t Cur Rec’ts & Exp, Table 3.2, Line 20
Income inequality and median income: US Census Bureau, Table F-5, Race and Hispanic Origin of Householder – Families by Median and Mean Income
