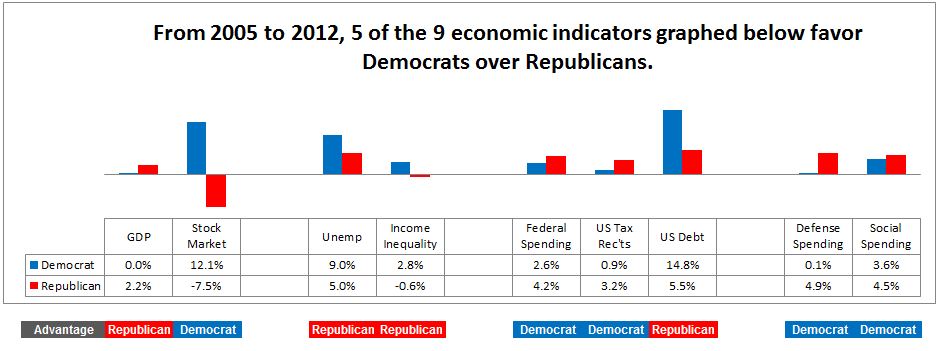
What’s graphed above is the annual change in the indicator. For instance, GDP grew 3.1% per year after inflation under Democratic Presidents and 2.5% per year under Republican Presidents, after inflation, between 1981 and 2008.
How do these numbers relate to the average American?
Higher GDP – Gross Domestic Product – under Democrats
- Higher Democrat GDP of .6% amounts to a $94 billion larger economy based on the 2012 GDP of $15.6 trillion dollars.
Higher stock market returns under Democrat administrations
- At the annual Democrat return of 14.3%, your stock portfolio doubles in a about 5 years.
- At the 3.7% annual Republican return, it takes 4 times longer – almost 20 years – for your portfolio to double.
Lower unemployment under Democrats
- Unemployment under Democrats was 1.2% lower. Based on the September 2012 civilian labor force of 155 million, a 1.2% lower unemployment rate equates to 1.8 million more jobs.
Faster growing income inequality under Republicans
- The income gap between the upper and middle classes in America rose more than twice as fast when a Republican was in the White House.
- Income inequality is defined as the excess of the mean (i.e., average) over the median family household income. A relatively small number of high incomes will cause the mean income to rise above the median income.
- When a Republican was in the White House from 1981-2008, the mean-over-median income premium increased 2% a year, more than twice as fast as the .93% annual mean-over-median income premium during Clinton’s administration.
More federal spending when a Republican was in the White House
- Federal spending barely grew under President Clinton, but it grew 3.7% a year under Reagan and both Bush Presidents.
Reduced federal tax collections under Republicans led to a lot more debt.
- Federal tax collections barely rose at all during Republicans (only .2% per year). The net result of this extra spending and lower tax collections – the federal debt grew 9.4% a year when Republicans were in office. At that rate, the debt doubles every 8 years.
- The inflation-adjusted federal debt quadrupled while Reagan and the two Bush Presidents occupied the White House between 1981 and 2008.
Defense spending grew 6.8% a year faster after inflation under Republicans
- Defense spending shrank 2.7% per year under President Clinton, but grew 4.1% a year under Republicans. At the end of President Clinton’s Presidency in 2000, the defense budget amounted to $5,029 per US family household (in current dollars not adjusted for inflation). At the end of President Bush’s Presidency in 2008, the annual defense budget amounted to $9,354 per US family household (again, in current dollars). What else in your household budget increased as much between 2000 and 2008?
Social spending also grew more than twice as fast under Republicans
- Social spending grew markedly faster, 4.5% per year when Reagan and the Bush Presidents were in the White House, vs. 1.9% a year under President Clinton.
Ok, so how does it look during the Obama administration?

The annual change in the indicator is graphed above
Obama inherited -2.2% GDP and 9.3% unemployment in 2009.
- The poor economy during Obama reflects the two biggest determinants of the economy: GDP hasn’t grown at all and unemployment has averaged 9% over the 4 years from 2009-2012.
But, today the GDP is growing 1.9% per year and unemployment is down to 7.8%.
The stock market has done well, returning 12.14% a year under Obama.
The federal debt is growing, but not because of spending – from 2008-2008, spending increased 60% faster each year under Bush
- The debt is growing 10.1% a year under Obama, but federal spending isn’t the problem – it was higher during Bush’s term, and this was true for both defense and social spending. Federal tax receipt growth has dropped to near zero, again a reflection of the economic standstill, and that’s a major cause for the increasing debt. But the biggest cause of the debt growth is the massive government borrowing for Fed Chairman Bernanke’s quantitative easing program.
Numbers don’t lie – go to www.presidentialeconomics.com and see for yourself.
Indicator – Data source – Web link
Gross Domestic Product, Bureau of Economic Analysis
US Stocks, Ibbotson 2012 SBBI Yearbook, Table A-1; for 2012, S&P 500 Ytd ret & div yield, Data proprietary and not available on the web
Unemployment, US Bureau of Labor, Since 1947
Federal Spending, Bur of Econ Analysis, Sec 3, Gov’t Cur Rec’ts & Exp, Table 3.2, Line 20
Federal Tax Receipts, Bur of Econ Analysis, Sec 3, Gov’t Cur Rec’ts & Exp, Table 3.2, Line 2
Social Spending,- Bur of Econ Analysis, Sec 3, Table 3.12, Social spending, Line 1
