Debt goes up when income falls and spending goes up.
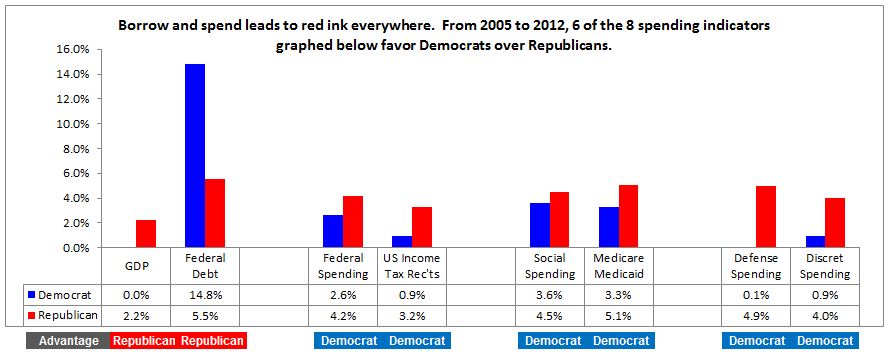
- The annual change after inflation is what’s being graphed above. The Federal Debt grew 14.8% a year under President Obama, for instance.
There’s a lot of talk about the huge growth in the federal debt, but what caused it?
A poor economy
- A poor economy – GDP growth fell to zero the last 4 years.
Lower tax collections
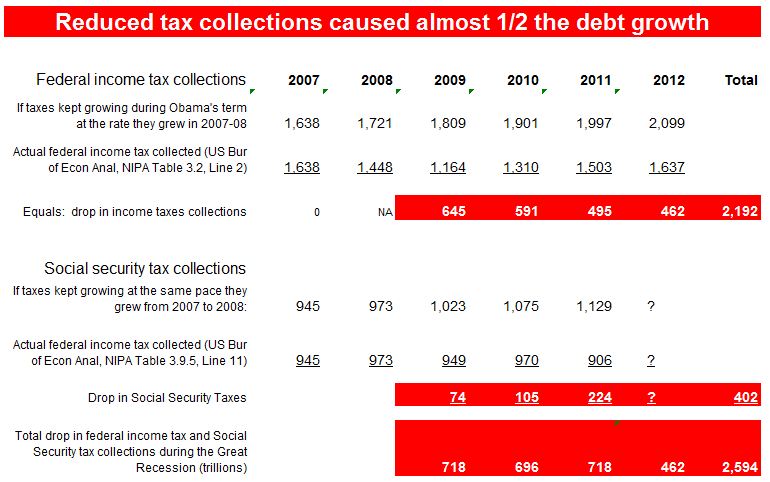
- Lower tax collections – The federal debt grew $5.5 trillion since Bush left office in 2008, but nearly half of that was from lowered tax collections. Look at this table:

- Source: Bureau of Economic Affairs, Table 3.2, Line 2, Fed Gov’t Current Rec’ts & Exp, Table 3.9.5, Line 11, 2009-2012 tax collections.
Can runaway spending under Obama be blamed?
- Look at the spending categories in the first graph above – when Bush was in office more was spent on defense, social spending, Medicare and Medicaid – across the board, Obama has spent less than Bush in every category shown.
This isn’t a new trend – Republicans have been outspending Democrats for 32 years.

The annual growth in the economic indicator, after inflation, is what’s being graphed above. The advantage goes to the party that spends the least (or collects, in the case of taxes) in a nod to Republican ethos.
The drop in tax collections tells only half the story. The rest of the debt growth the last 4 years is due to increased federal spending. Republicans spent more than Democrats, so pinning the debt growth on Democratic Presidents is disingenuous.
See for yourself at www.presidentialeconomics.com.
Indicator – Data source – Web link
GDP, Bureau of Economic Analysis, Current-dollar and “real” GDP
Spending figures for the following categories are available at the Bureau of Economic Analysis
Federal Debt, Sec 3, Gov’t Cur Rec’ts & Exp, Table 3.2, Line 46.
Federal Spending, Sec 3, Gov’t Cur Rec’ts & Exp, Table 3.2, Line 20.
US Tax Receipts, Sec 3, Gov’t Cur Rec’ts & Exp, Table 3.2, Line 2.
Social Spending, Sec 3, Table 3.12, Social spending, Line 1.
Government medical spending, Sec 3, Table 3.12, Line 6 – Medicare, plus Line 33 – Medicaid.
Defense Spending, Sec 3, Table 3.9.5, Gov’t Consumption Exp & Gross Invest, Line 11.
Discretionary spending, Sec 3, Table 3.2, Gov’t Cur Rec’ts & Exp, Line 21 – Consumption Expenditures.

